Simon Breslav, Rhys Goldstein, Azam Khan, Kasper Hornbaek
Exploratory Sequential Data Analysis for Multi-Agent Occupancy Simulation Results
Symposium on Simulation for Architecture and Urban Design
2015

Exploratory Sequential Data Analysis for Multi-Agent Occupancy Simulation Results (5:00 min.)
Abstract
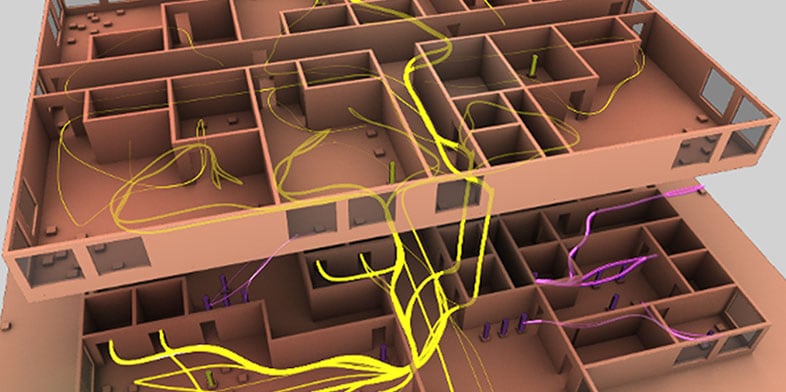
In this paper we apply the principles of Exploratory Sequential Data Analysis (ESDA) to simulation results analysis. We replicate a resource consumption simulation of occupants in a building and analyze the results using an open-source ESDA tool called UberTagger previously only used in the human-computer interaction (HCI) domain. We demonstrate the usefulness of ESDA by applying it to a hotel occupant simulation involving water and energy consumption. We have found that using a system which implements ESDA principles helps practitioners better understand their simulation models, form hypotheses about simulated behavior, more effectively debug simulation code, and more easily communicate their findings to others.
Related Publications
Loading...
Related Projects
-

Building Simulation
Buildings are the largest consumers of energy responsible for 48% of all Green House Gas (GHG) emissions. Due to the complexity and multidisciplinary aspects of architectural design, construction, urban design, and building occupant behavior, simulation has gained attention as a means of addressing this enormous challenge. The idea is to model a building’s many interacting subsystems, including its occupants, electrical equipment, and indoor and outdoor climate. With simulation results in hand, an architect is better able to predict the energy demand associated with various designs, and choose from among the more sustainable options.
-

Visualization & Visual Analytics
Visual data representations leverage the power of human perception to process complex information, and through interaction, garner new insights. Our research focuses on visualizing data from a wide variety of domains and fundamentally tackles the question, what makes a visualization effective? We explore novel visual encodings and interaction techniques, multiscale approaches, and even simulation to bridge human and automated analysis of multivariate, time-series, and graph data, ultimately aiding in hypothesis generation, testing, and sense making.
-